Filter by Brand Clear Filter
12 May 2023

Embracing chaos to develop resilience

We challenged technology teams to test a long outage of a configuration application in a production environment for an hour without losing any requests using Chaos Engineering. And guess what? We did it!

by | Berlin

19 Jan 2023

Creating an SRE Culture while preventing a 12 million order loss

Back in 2019, we were in a race to constantly build new features while trying to juggle stability. During this phase, technical debt was piling up and the reliability of the platform was suffering. We had a “stability” meeting with all of the backend and infrastructure chapters EVERY morning to talk about the incidents we caused and what we were going to do next. I used to call this meeting “The ring of fire”.


Operation Hawk

We decided to call our Observability project ‘Operation Hawk’, as a Hawk has better vision than humans. We had too many different observability tools, all spread out among local squads. The goal of this project was to bring observability to one single place, while increasing ownership on local teams so that the data could be as trustworthy as possible.

The foundation of Operation Hawk was, and still is, the implementation of the Four Golden Signals mentioned in the Google SRE Book. However, before implementing it, we needed a new tool.

The Hunt

We wanted our observability data to be in one place, so we began the hunt for the right tool. At Delivery Hero, we only make architectural decisions through RFCs, so we started a couple of RFCs and POCs until we found the right tool.

The Golden Path

Our mission as a team was to enable Heroes to achieve Operational Excellence by providing Best Practices, Observability and Governance throughout the application lifecycle – meaning that we wanted to lower the adoption bar by providing a standard and self-service approach for every service or tool that we provide, as we have a self-service mindset regardless of the solution we provide.

With that in mind, we created our SRE Framework.

The SRE Framework

At Delivery Hero, we invest time and effort into monitoring our services from day one.

We created the SRE Framework with various maturity levels, based on the adoption of the SRE best practices. The SRE framework creates a golden path to increase the reliability and stability of the platform while promoting the SRE culture in local teams and giving service owners the ownership and independence they need.

The SRE Framework is split into 5 Maturity Levels. The squad was given ‘Maturity Level 0’. For Maturity Level 0, we provide an awesome list of resources so that one can learn what SRE is. At Maturity Level 4, squads own the whole process of ‘how to SRE’ in their local teams.

“…And, as we all know, culture beats strategy every time”

One of Delivery Hero’s core values is “We always aim higher 🚀”.

We quickly learned that by making it easy for our developers/stakeholders to do the right thing, the path to adoption is made easier. Therefore, we decided to spend time and effort making adoption of the golden signals and observability best practices the ‘easy option’ for our developers, by including monitoring directly into the modules used to create infrastructure, rather than pointing them to resources they could use to create those monitors themselves. Doing so meant every service and its underlying dependency had a fantastic observability stack ‘out of the box’, driving the proportion of services covered by 100% and empowering engineers to own their own stack.

This is now the default approach for our solutions, it’s called “Batteries Included”.

Batteries Included

Imagine you buy a toy for your child for Christmas. They rip the wrapping paper open excitedly to see what gift they have received. Their face lights up, they want to start playing immediately – but the toy needs  2 AA batteries. You go and find the packet (or take them from the TV remote). At that moment, the excitement of opening a new toy turns to frustration. 

Toy manufacturers became aware of this and started to include batteries directly in their toys, resulting in happy kids and less frazzled parents. This is the ‘batteries included’ approach. 

In product usability (mostly in software) it states that the product comes with all possible parts required for full usability. It means that the local teams now have all the observability out-of-the-box when they onboard their service. Not only this, but whenever a resource is created on AWS, it will already have all the Observability included.

Batteries included is now our approach at Delivery Hero.

Conclusion

With the right tools and data to create awareness about application performance, along with the underlying dependencies and costs, we were able to shift the Engineering Culture and improve our MTTD (Mean Time to Detect) and MTTR (Mean Time to Recovery) by 195% and 282% consecutively, and the percentual overall reduction was at around 327% less minutes in incidents.

In other words, Delivery Hero makes approximately 2 thousand orders per minute. If we calculate the difference, we can see that the reduction of both MTTD and MTTR helped us prevent an order loss of more than twelve million orders in the last two years.


If you like what you’ve read and you’re someone who wants to work on open, interesting projects in a caring environment, check out our full list of open roles here – from Backend to Frontend and everything in between. We’d love to have you on board for the exciting journey ahead!

by | Berlin

06 Jan 2023

How Disco SRE improved Infrastructure Security at scale

Infrastructure security and application security are two subjects that go hand in hand in improving security across teams and organizations. This article focuses on how Global Discovery SRE team achieved in optimizing and improving overall security for GCP based Infrastructures and applications.


With the onset of rapid expansion of multiple teams and Cloud based resources, the necessity to streamline and improve safety and security with state of the art security and protection mechanisms was needed. Overtime development teams supported by Global Discovery SRE had substantial increases in their business and products resulting in exponential increase in usage of Infrastructure resources and applications.

The Global Discovery SRE team with active collaboration with Delivery Hero Security team and Security Operations team implemented cutting-edge security mechanisms and protections for Cloud based resources and services. Using a system of well defined security scoring with fine grained topics and milestones, a statistical calculation of continuous security improvements were achieved.

Automated Scans

Ensuring early identification and vulnerability detection through automated scanning for any potential sensitive data, security breaches, code quality, anomalies in public facing components and infrastructure resources can help SRE and development teams to prevent any security breaches.

All public facing environments exposed via Cloudflare are scanned extensively and logged for future reference. Using a combination of Sonarqube and inspector gadget automated scans all resources and code repositories are scanned for any sensitive data, potential security issues and data leaks.

To bolster our automated scans further, Delivery Hero Security team conducts ASV scans on a quarterly basis and generates reports as part of our continuous security improvement.

Configuration and Secret Management

Securing secrets, configurations and any sensitive information with fine grained access to only desired resources or users for any production and non-production environments are vital for any organizations. Global Discovery SRE uses Vault identity based secrets and encryption management system as the single source of truth for protection of all sensitive information and secrets stored in a centralized location. Database backups subjected to retention policies and passwords are always encrypted. These mechanisms ensure each team is provided access to only the required secrets on demand and based on the allocated policies and privileges for the teams. 

Patch management

The SRE team uses GKE managed kubernetes clusters with GCP hardened OS images for deploying applications and softwares. All GKE node pool virtualized servers and master planes are auto upgraded and patched by GCP. Container images specific to Disco SRE team are always built and patched with a stable version automated via our CI/CD tool. All container images are OCI compliant and scanned during build for any vulnerabilities.

Log management

Log management involves centrally collecting, parsing, storing, analyzing, and disposing of data for purposes of identification, troubleshooting, performance management and security monitoring.

All network data traversing through our infrastructure are monitored via GCP and Datadog. All external traffic entering/exiting Cloudflare is scanned and logged. Once the network traffic crosses the NAT Gateway, it is then again captured at nginx ingress controlled in the GKE cluster before being directed to target GCP services. This allows us to have an end-to-end picture of the network traffic navigating inside our infrastructure.

Audit logs are enabled for each project platform. This helps to provide a security-relevant chronological record, data that provide documentary evidence of the sequence of activities that might have affected at any time in a specific operation. The logs once captured are stored as files in a central location and can be accessed by SRE team and other development teams having access privileges.

Hardening and Network Security

CIS Benchmarks help to set consensus-driven best practices for teams to implement and better manage their cybersecurity defenses. The Global Discovery SRE team using GCP provided services and images has achieved in implementing hardened secure configurations for OS and applications.

Securing networks and continuously improving the security mechanisms to adapt to changing technological landscapes and threats has always been a high priority for our team. Cloudflare acts as the first layer of protection for all public facing environments for our infrastructure. Cloudflare based DDOS protection, Firewall rules and TLS encryptions for all external traffic entering helps to bolster the Layer 7 defense. Once the traffic crosses Cloudflare, NAT Gateway changes IP ranges for Public to Private network conversions.

GCP based fine grained network policies and firewall rules help to further improve internal network protection inside the platform. All components inside the platform’s are in private subnets and could only be accessible by resources in the same VPC and through corporate provided VPN.

Database instances specifically need to be restricted from any public access are provisioned inside private subnets with restricted access to only allowed users or applications within the platform. 

2 Factor Authentication is enabled for all possible scenarios as an added protection for our global tools, internal tools and back-office tools. WPA2 Enterprise based protection is enabled for all wireless network communications with network segmentation for both corporate and platform networks.

The Global Discovery SRE team actively collaborates with the Security and Security testing teams conducting Blackbox and Whitebox penetration tests annually. This helps us to continuously improve and maintain our overall infrastructure and application security and network security with early identification of any form of vulnerabilities. All test reports and results are captured and stored for future references. 

How continuous security improvements benefited Dev Teams?

Development teams are in a constant state of developing and improving applications with each application involving different technical and security aspects. The Discovery SRE team takes into consideration every feedback and improvements received from each development team. Each security advancements are always implemented in a unified tribe level benefitting order. With continuous security improvements strategically planned in a phase by phase order with active collaboration with multiple development and security teams, Discovery SRE team abstracts away the security complications and encapsulates all required security aspects in a simplified and streamlined order.

This approach provides multiple benefits.

  • Improves teams total bandwidth by allowing them to focus on their development tasks without being hindered by security ordeals.
  • Continuous security protection with early identification and detection of any security vulnerability and risks with status notification to each team.
  • Faster warning systems and alerting mechanisms for any security breaches and incidents allow teams to take immediate actions and effective remedies.

Better security awareness and understanding of security compliances for each team.

Conclusion

In summary, Infrastructure and application security are always in a state of continuous improvement. With the changing technological landscape, cloud based tools and resources, improving and maintaining security at the highest standard has always been a top priority for the Global Discovery SRE team.

With streamlined security mechanisms, tools and standards, transparent processes and continuous security improvements actively collaborating with multiple Development, Testing and Security teams. All of these help the Global Discovery SRE to always be a step ahead in security and compliance.


If you like what you’ve read and you’re someone who wants to work on open, interesting projects in a caring environment, check out our full list of open roles here – from Backend to Frontend and everything in between. We’d love to have you on board for an amazing journey ahead.

by | Berlin

04 Jan 2023

How we boosted our K8s infrastructure performance whilst reducing costs

Search and Discovery in Delivery Hero runs highly available global APIs that provide load balancing and automatic failover.  We deploy our APIs in at least 2 regions from each geographic location we serve, and in 3 zones within these regions, so it’s important to be very cost-effective in the way we do this.

This post describes the steps we took to improve our GKE infrastructure, which lead us to cost reductions between 25% to 50% on the different regions our API runs in.

  • Provisioning model: Using spot instances as much as possible.
  • Machine type: Choosing the right machine family and type for our use case.
  • Region selection: Identifying the most cost/effective regions we can use.
  • App right-sizing: Configuring our pods to use the right amount of resources.
  • Bin packing: Making sure our pods can fit nicely in our nodes without wasting resources.

Initial investigation

The first step in our journey began by understanding the requirements of our current infrastructure and identifying the areas we wanted to investigate for improvements.

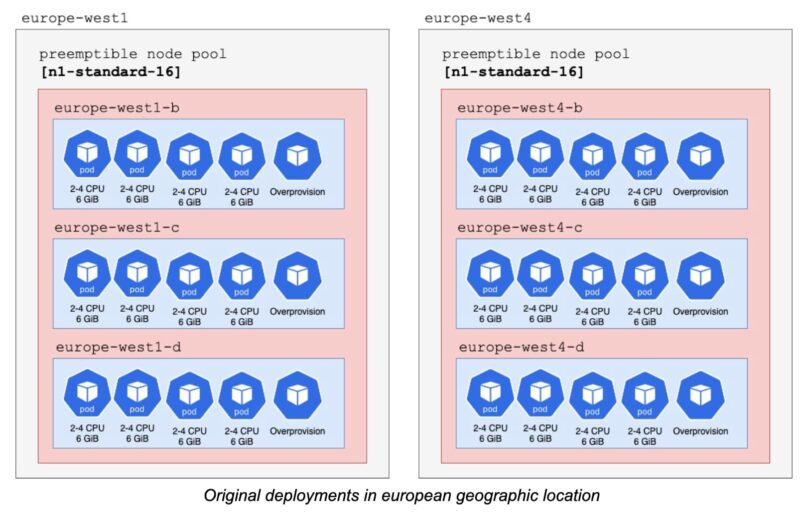
Our infrastructure needs to be error tolerant.  We create virtual machine instances across three availability zones located in at least two regions per geographic location.  This ensures that even if a zone or an entire region fails, our application continues to work.  For example, in Europe we deploy in 2 regions: europe-west1 and europe-west4.  In each of these regions, we have deployments in 3 different zones.

Our APIs also need to run in pods that can be killed at any time without impacting the system.  This flexibility allows our API to survive node shutdowns without affecting our service.

Keeping this in mind, we were ready to investigate the cost/effectiveness of our current infrastructure setup.

Provisioning model

Spot VMs offer the same machine types, options, and performance as regular compute instances, but they are considerably cheaper (according to Google, up to 91% cheaper).

The critical thing to keep in mind for Spot VMs, is that they can be gracefully shutdown (with a 30 second grace period) at any point in time.  So if you want to use them, you need to be sure the application is fault tolerant and can handle this kind of VM behavior.

The API we were analyzing was already fault tolerant. It was running with preemptible instances, which is the previous version of spot instances. We decided to start planning on the upgrade to spot instances to take advantage of the new features, but it wasn’t marked as a priority since spot and preemptible instances share the same cost model, so it wouldn’t have a cost impact.

Machine Type

Google Kubernetes Engine offers different machine type families, and we have to make a decision on which to use based on the needs of the application.

  • General Purpose: The most flexible vCPU to memory ratios, providing features that target most workloads.
  • Compute-optimized: Ideal for performance-intensive workloads.
  • Memory-optimized: Ideal for workloads that require higher memory to vCPU ratios.
  • Accelerator-optimized: Optimized for massively parallelized Compute Unified Device Architecture (CUDA) workloads, such as machine learning (ML) and high performance computing (HPC).

In our case we know our API falls in the General Purpose category: it is neither memory or vCPU intensive, and it requires a flexible vCPU to memory ratio.  Actually, it was running already on N1 instances.

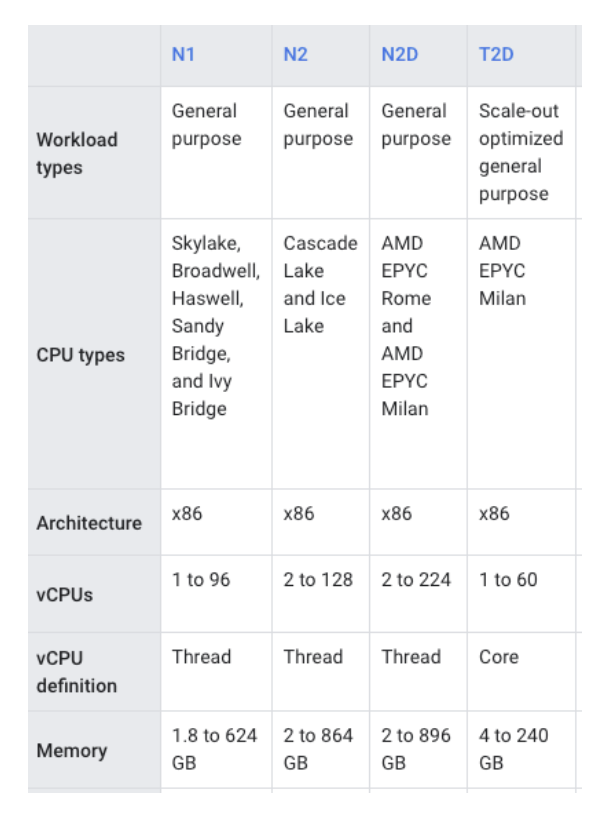
With this in mind we proceeded to find the right machine type from the new options available in this family: N2, N2D or T2D.  

The main difference between them is the processor (each processor comes with a different set of features) and the vCPU to memory ratio capability. 

To know which machine type worked best for our use case, we created clusters for N2D and T2D machine types and load tested our API against them.  We then compared the results between them and against the N1 machine type we already had in production.

With this exercise, we were able to see how our application performed under real stress using each of the different machine types.  We compared values such as:

  • Latency of the responses (p90 /p95 / p99)
  • Success rate
  • Ability to scale up and down quickly with demand.
  • Total vCPUs used during the load test

The results were very positive, we noticed that we could run on both N2D and T2D clusters the same load we did on N1, but using around 35% less vCPU in N2D and 45% less in T2D.  Both without having a negative impact on latency or errors.

Region selection

The three main things we analyzed when selecting which regions to deploy our service at were: latency, machine availability and cost.

To evaluate latency, we analyzed the location of our clients and the location of our upstream and downstream dependencies.  This gave us a good picture of which regions might work well for us.  We then created clusters on those regions, deployed our API there and performed load tests.

During the load test we observed the different latency values we got from each region.  This gave us clear evidence of how each region would perform in production for our API, and helped us decide which ones we could use and which ones we should avoid.

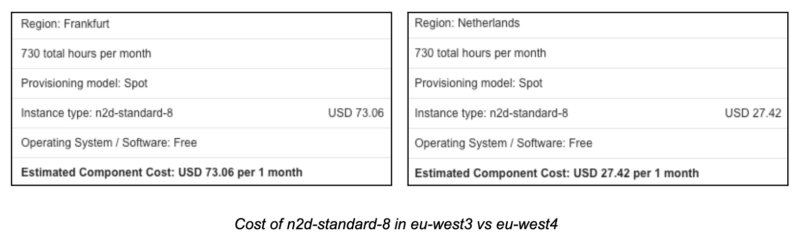
We then used Google Cloud Pricing Calculator to get an estimate of the different costs each machine type had on each region.  It is important to know that not all machine types are available in all regions, and that the price of the same machine type may be different between regions.

For example, while analyzing the price for the same N2D instance in different european regions, we found important differences.  The region that reported the best price was europe-west4, where each instance costs $27.43.  In contrast to europe-west3, where the price for the same instance is $73.06.

During the time of our evaluation, T2D was available in fewer regions than N2D, so it limited us on where we could deploy this instance type.  It was also available in regions with higher costs, making it less appealing cost-wise.

App right-sizing

According to Google’s announcement, N2D offers 39% performance improvement on the Coremark benchmark compared to comparable N1 instances.

By upgrading from N1 to a new generation of machine types, our goal was to squeeze more juice out of the more performant vCPUs.  We expected to deploy pods with less vCPU and to increase the vCPU threshold value used by our horizontal pod autoscaling (HPA), while still performing the same or better.

To determine the best values we could set for our resource configuration, we performed load tests with different vCPU values and different HPA configurations, while monitoring our latency and error rate metrics.

In the end we managed to incorporate these changes:

  • We increased our HPA threshold from 35% to 50% since the pods with more performant vCPU were able to get more work done.
  • We reduced the vCPU requests value from 2 to 1 because with a more performant machine type we were able to run our pods with less vCPU.
  • We reduced the memory requested by our pods from 6GB to 4GB, because we noticed we were already overprovisioning it, by checking the pod’s dashboards.

So we effectively were able to cut our workload’s vCPU requested value by 50%, and our memory requested value by 33%.

Bin packing

Once we had the right configuration of vCPU and memory for our pods, we needed to make sure we had the right node configuration, so that pods could fit nicely in them without wasting resources.

This is accomplished by bin packing.

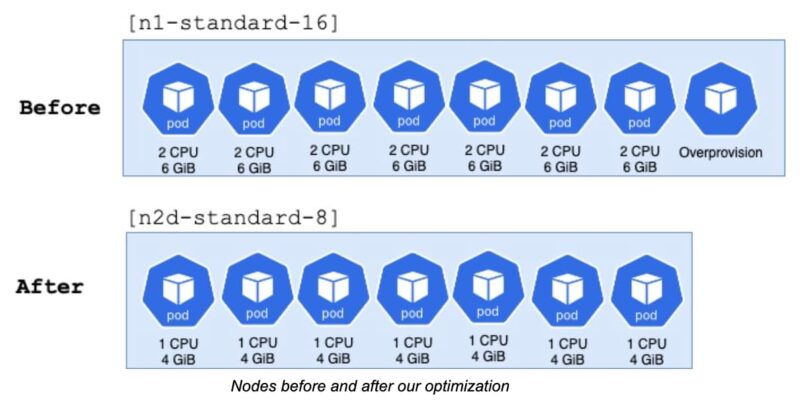
After optimizing the resources of the pods on the step before, we defined we required 1 vCPU and 4GB of memory for each one of them.

We chose to use nodes with n2d-standard-8 machine types.  This meant that each node had a total of 8 vCPU and 32GB of memory.

With this configuration, we were able to fit 7 pods in the nodes, using 7 out of 8 vCPUs and 28 out of 32GB of memory.  Keeping in mind some vCPU and memory are reserved and not available for our pods, this machine type was a very good match for our needs.

As an added bonus, with the new machine types we managed to remove the overprovision pods that we used in our N1 nodes.  Their purpose was to have resources pre-allocated to quickly provision new pods when needed, and reduce the waiting time for new nodes to be ready.  

Since the new machine types were more performant, they managed to handle more load effectively and the wait time for new nodes to be available while scaling up didn’t cause us any issues.

Cost evaluation

Once we had everything in place, we knew we had the right machine type and that it would perform well against our API, but we still needed to validate that it was also going to be less expensive than our current setup.  To validate this we followed these steps: 

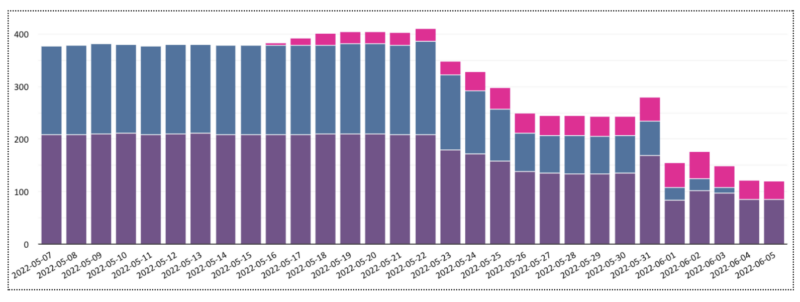
At the beginning, we had 2 clusters using the old machine type n1-standard-16.  Traffic was being load balanced between them 50 / 50. They’re represented in the image above with blue and purple colors.

We then added a third cluster with the new machine type n2d-standard-8, shown above in pink.  We slowly sent all traffic from the purple n1 cluster into the pink n2d cluster.  Eventually, only the blue n1 and pink n2d clusters were serving traffic.  The purple n1 cluster was idle.

At this stage, we were able to notice that the pink n2d cluster had a very significant cost reduction over the original purple n1 cluster.  So we continued with the deployment.

The next step was to replace the machine type from the purple n1 cluster with the new n2d-standard-8 machine type.  At this point the purple n1 cluster was not serving traffic, only blue n1 and pink n2d were serving traffic.

Once the purple n1 cluster was converted into a purple n2d cluster, we switched all traffic from the blue n1 cluster into it and proceeded to remove the blue n1 cluster from our infrastructure.

In the end, we were left with the purple and pink clusters, both using n2d-standard-8 machine types, and both showing a significant cost reduction from our original setup.

Conclusion

Optimizing the Google Kubernetes Engine infrastructure we use to run our application required investigation to understand our system needs, several tests to validate the performance of the different alternatives we had, and an evaluation in production to validate cost expectations.

The main aspects we focused on were:

  • Making sure our application is fault tolerant and can make use of the more economic spot instances.
  • Upgrade to a new generation of machine types, to have less but more powerful resources.
  • Find the best region we can use to deploy our service that provides good latency and lower costs.
  • Fine tune our application to use the right amount of request resources and autoscale configurations.
  • Pack our application properly so that pod requested resources fit in the node resources.

Running actual load tests in different clusters was the key to know how the system will actually perform on each of them.  This helped us select the most performing regions and machine types, ruling out the slowest or more inefficient ones, based on the actual metrics gathered against the real use case: our API.

Once the best performing candidates were selected, using them in production for a time-boxed period of time, validated if our cost projections were real, and allowed us to make a final decision on which region and machine type to use, based on real performance and cost metrics.


If you like what you’ve read and you’re someone who wants to work on open, interesting projects in a caring environment, check out our full list of open roles here – from Backend to Frontend and everything in between. We’d love to have you on board for an amazing journey ahead. 

by | Berlin