Boosting the Reliability of ML Models with Feature Quality Monitoring
10 October 2023
Ensuring feature quality is crucial for the performance of ML models. Leveraging our experience at Delivery Hero, we’ve developed components that integrate with our Feature Store to tackle data issues. This article will explore the processes for maintaining feature quality, as well as the advantages gained through effective feature monitoring.
Data Quality Issues
Maintaining high-quality features is a fundamental task to guarantee the performance of machine learning models. When it comes to feature pipelines in production, data scientists face significant challenges in ensuring the feature quality and reliability for their ML models.
The most well-known challenge in maintaining features is related to changes in data sources. Data producers may introduce changes to data sources over time. Some common issues are deprecation of certain tables, dropped columns, and out-of-domain values. These factors could impact the integrity of data used by features, disrupting the feature engineering process.
Another common challenge is related to data distribution shifts that occur due to various reasons, such as changes in business processes or unpredictable external events. Unforeseen events, such as sudden spikes or drops in data volume, can disrupt data distributions and subsequently affect the feature distribution.
In addition to data source changes and distribution shifts, feature transformation bugs can also undermine the quality of features. During the creation of feature codes, errors can be introduced by their creators. These bugs can lead to incorrect calculations, improper data manipulation or skewed representations of underlying patterns.
Unlocking Feature Monitoring
As a ML platform team at the Data & ML product line, we have developed some monitoring components that are seamlessly integrated to our Feature Store empowering data scientists and ML engineers to identify data quality issues and detect data distribution shifts in order to mitigate their impacts on ML models.
We implemented two types of feature monitoring components. The Quality Checks component is used to assert what is expected from the feature data generated by feature pipelines. The Drift Detection component is used to detect sudden changes in feature distributions. Both are detailed in the next sections.
Quality Checks
This component is built on top of Great Expectations and allows data scientists to define expectations for their features to validate the feature data generated into the Feature Store. Some examples of expectations could be:
- Expect column values not to be null
- Expect the value to be between X and Y
- Expect column values to be unique
- Expect this table to have between m and n number of rows
- Expect compound columns to be unique
- Expect column distinct values to be in set A, B, C
The Great Expectations package is a battle-tested software used extensively by many companies already. It provides a robust suite of tools to build automated testing for data, including profiling, expectations, and data docs. It supports the creation of expectations using Pandas, SQL or Spark. It’s extensible to add custom expectations. However, as per our experience, it has a hard setup for integrating within Python applications in comparison with its CLI interface. We decided to create a wrapper to make setup easier for our data scientists.
Within the shared feature repository, a designated folder titled “monitoring” is available for users to craft monitoring modules using Python. For data quality checks, each module must implement a standard function that receives a dataset validator object. Users implement this function by writing expectations, which is achieved by leveraging the syntax of the Great Expectations.
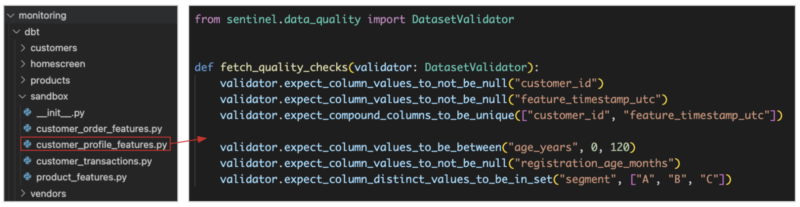
By creating a wrapper and providing a command-line interface (CLI) for data scientists, we have made it more convenient and user-friendly to utilize the monitoring modules and access the data docs generated by the Great Expectations. With the CLI, they can run the monitoring modules locally, allowing them to validate expectations against feature data from staging tables. Here is an example of the validation report for the example presented above.
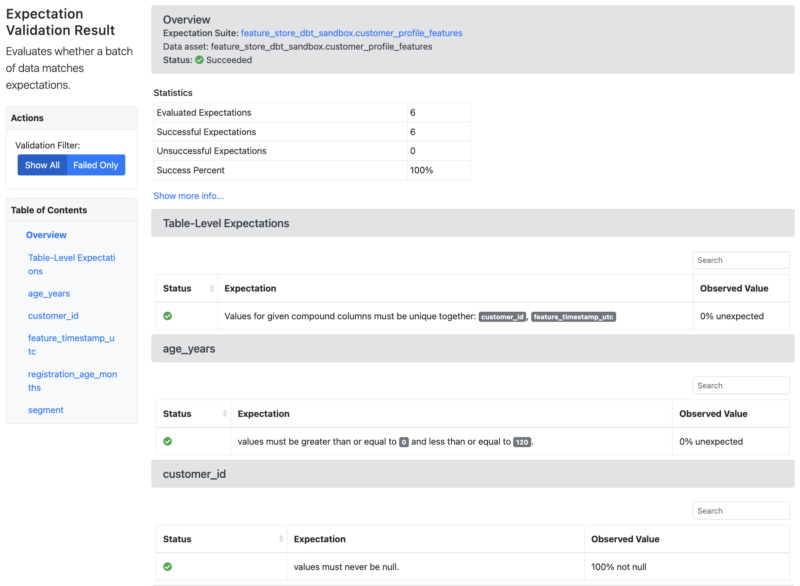
In the generated report, users can verify data quality issues for the feature data, and if any expectation is failed, the report will highlight those issues. By pointing out the failed expectations in the report, users can quickly identify which aspects of the feature data require attention and remediation.
Drift Detection
This component allows data scientists to identify sudden shifts in the distribution of their feature data, a factor which can significantly impact the performance of data science models. Built upon the EvidentlyAI package, it offers users the flexibility to craft drift configurations within the monitoring modules.
Creating a drift configuration mirrors the process for defining quality checks, i.e. users just need to include a function that must implement a standard function within the desired monitoring module. This function is expected to yield a drift configuration.
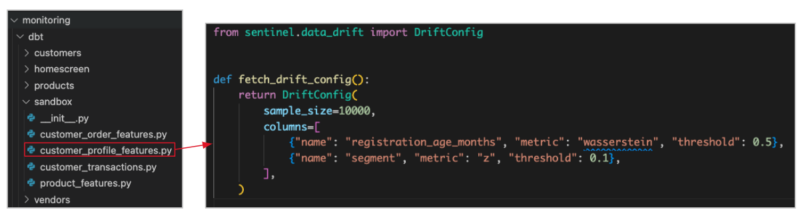
In the given example, the function fetch_drift_config yields a drift configuration. This configuration entails the sample size, along with a dictionary of column details. The column information encapsulates the feature name, the relevant statistical test applied, and the designated threshold set for that specific test.
Utilizing the CLI, users can run monitoring modules directly from their local environment. This allows them to execute drift detection modules against feature data from staging tables. Following is an illustration of an HTML report generated for the drift configuration above.
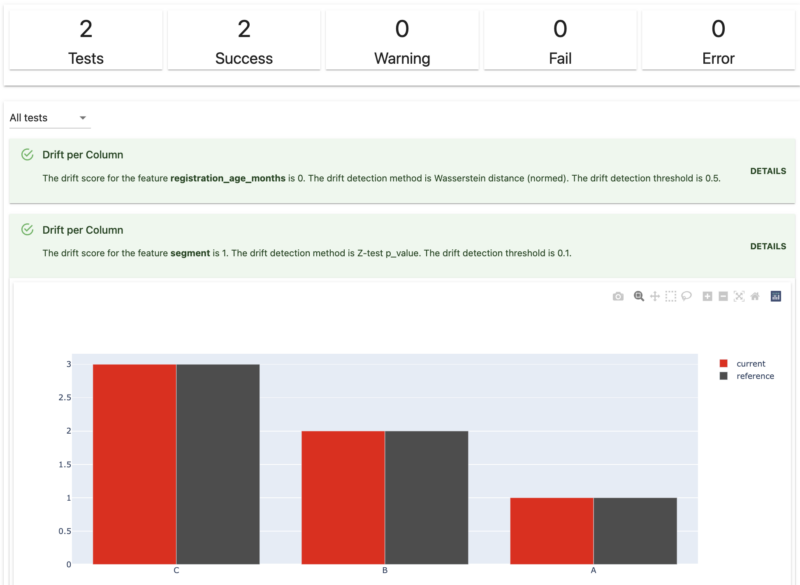
This report format provides users with a streamlined and efficient means of comprehending drift detection outcomes, enabling them to swiftly grasp the implications and take appropriate actions.
Inside The Workflow
Following our standard workflow, after creating and testing monitoring modules in their local development environment, data scientists must open pull requests to add monitoring modules to the Feature Store. Those PRs are reviewed by their peers to ensure code quality and consistency.
Once the changes are merged into the main branch, new monitoring tasks are added as part of the feature pipelines that operate in the production environment. Here is the high-level overview of the setup.
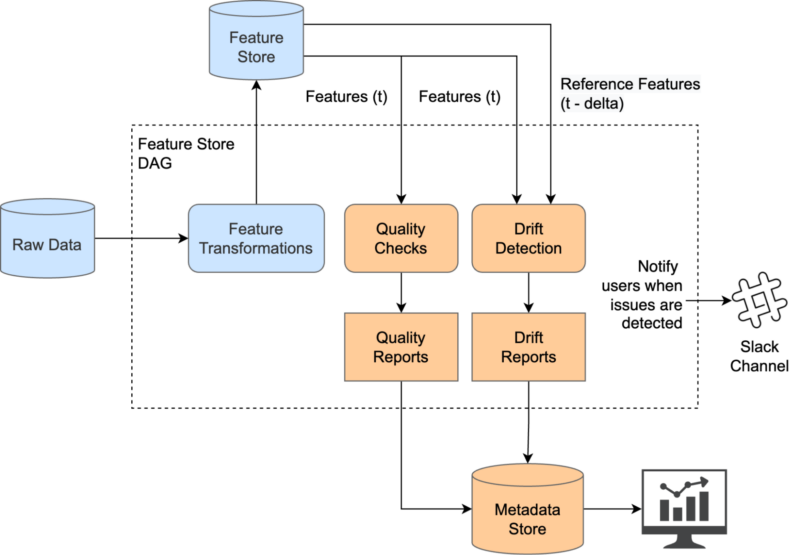
The input for the Quality Checks component consists of features generated in the Feature Store at a given timestamp, regardless of the interval in which they are generated (e.g. daily, hourly, minutely). On the other hand, the input for Drift Detection includes features generated at a given timestamp, as well as a reference timestamp from the past, since it will use these inputs to calculate drift between those two feature distributions.
Monitoring tasks generate two kinds of artifacts: metrics and reports. Both are tracked into our Metadata Store. Users can search for artifacts by business context (e.g. vendors, customers, products), table names, and countries and select the monitoring task run. For each run, they can visualize metrics and HTML reports. Metrics allow users to assess the performance and behaviour of their monitored features. HTML Reports serve as a consolidated view of the monitoring results, making it easier for users to interpret and understand the findings.
Last but not least, when a monitoring task fails (e.g. unsuccessful expectation, detected drift), data scientists who maintain those failed features are marked in Slack notifications to investigate and resolve the underlying issues. They can engage in discussions, collaborate with their team members, and coordinate efforts to correct problems efficiently.
Conclusion
By implementing a feature monitoring capability in our Feature Store, we have improved the feature management process and significantly enhanced the quality of features. The feature monitoring enables us to closely track and validate the feature data throughout its lifecycle, ensuring that it meets the desired expectations.
Without question, these components have proven to be valuable in helping data scientists detect critical issues in their feature data. Some examples include:
- Unexpected duplication of keys in data source tables. Unforeseen duplications were detected, likely due to systematic inconsistencies in data collection or aggregation processes.
- Missing data due to ELT script changes. Essential data was found to be missing as a consequence of changes in ETL scripts by data producers.
- Country-specific event-triggered distribution shifts. Significant shifts in feature data distribution were observed in specific countries owing to unpredictable events, causing a change in the original characteristics of the data.
- Incorrect feature data. Erroneous feature values may surface due to bugs in the feature transformation codes. Feature codes might contain errors or inconsistencies, and debugging them can become a challenging task, especially considering complex queries.
- Out-of-domain values in feature data. The lack of robust validation in data production permitted the introduction of out-of-domain values, resulting in a high level of noise in data.
Based on our experience, we’ve frequently witnessed instances where data issues were swiftly pinpointed at the feature generation stage, allowing data scientists to promptly investigate and identify the root causes. This proactive approach has effectively reduced the adverse influence of such issues on the performance of actively deployed ML models, thereby ensuring a more reliable and optimal operation in a production environment.
The header image is generated by DALL-E using Bing. The prompt is “A robot inspecting the ingredients of a meal and generating a dashboard of results to ensure the quality of the company’s data”.
If you like what you’ve read and you’re someone who wants to work on open, interesting projects in a caring environment, we’re on the lookout for Data Architect – Principal Machine Learning Engineers. Check out our full list of open roles here – from Backend to Frontend and everything in between. We’d love to have you on board for an amazing journey ahead.